Live Map
Live map of stations heard on RF and APRS-IS
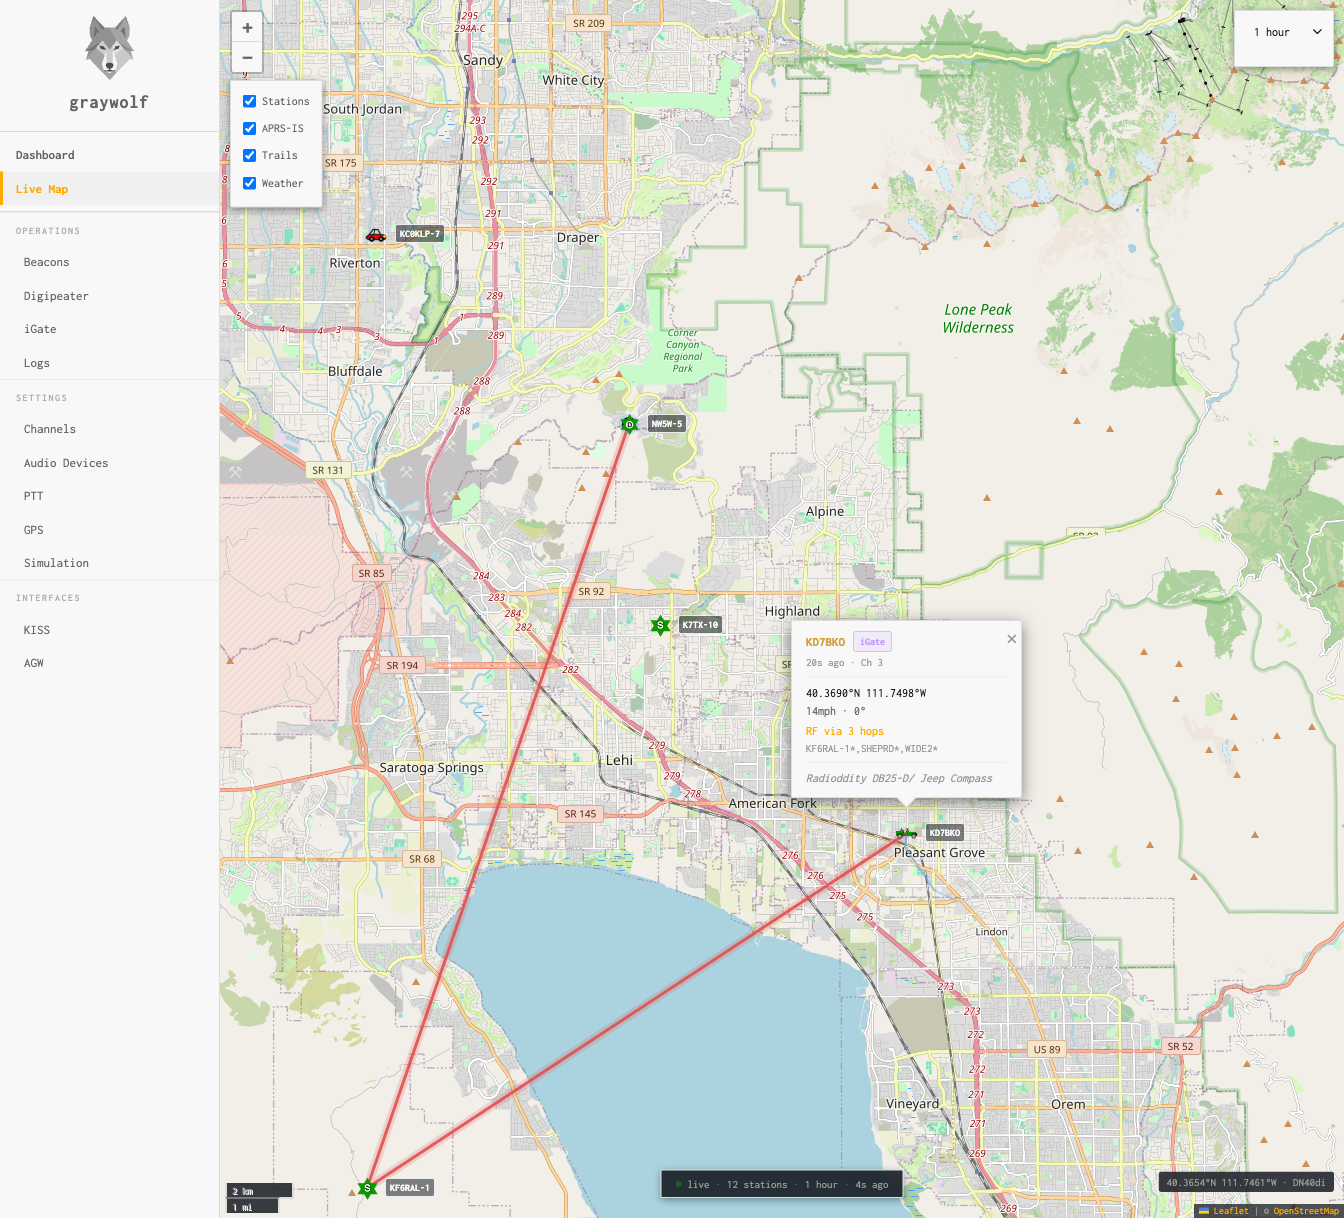
Every station you hear — on RF or through APRS-IS — lands on the live map with its APRS symbol and callsign. The map keeps itself current in the background and zooms automatically to cover the stations you’re hearing right now.
Pick a basemap on the Maps page: the Graywolf basemap (free, takes one click to register your station) or plain OpenStreetMap. You can also pre-download maps for the states you operate in, so the map keeps working when you’re off-grid.
Layer Controls
The layer panel (top-left, below the zoom controls) lets you toggle what’s displayed on the map:
| Layer | Description |
|---|---|
| Stations | APRS station markers with standard symbol icons and callsign labels. Click a marker for position, path, comment, and heard-via details. |
| Trails | Polyline trails showing the recent movement path of mobile stations. |
| Weather | Temperature and wind labels for stations reporting weather. |
| My Position | Your station’s position marker, taken from your GPS or your last beacon. |
| Direct RX | Off by default. When on, the map only shows stations you’ve heard directly on RF inside the time range — digipeated and APRS-IS (iGated) packets are hidden. A station qualifies if at least one of its packets in the window arrived with zero digi hops. |
On mobile devices, the layer panel collapses to a button to save screen space. Tap the layers icon to expand it.
Time Range
The time range picker controls how far back the map looks. Stations not heard inside that window drop off the map. Pick from 1 hour, 2 hours, 4 hours, 8 hours, 12 hours, 1 day, 2 days, 4 days, or 7 days. Anything beyond a few hours needs the Position Log enabled, otherwise older stations get cleared on restart.
Station Popups
Click any station marker to see a popup with detailed information:
- Callsign and APRS symbol
- Position — latitude, longitude, altitude, and Maidenhead grid square
- Heard via — RF direct, RF via digipeaters (with hop count), or APRS-IS
- Digipeater path — the full path the packet traversed
- Comment — the station’s comment field
- Last heard — how recently the station was heard
Status Bar
The status bar across the bottom of the map shows:
- Position readout — latitude, longitude, and Maidenhead grid square under the pointer (desktop) or at the center of the map (phone/tablet), with the current zoom level.
- live — lit when the map is keeping itself zoomed on the stations you’re hearing. Pan or zoom yourself and it switches off; click live to turn it back on.
- Station count — how many stations are currently on the map.
- Time range — the time window you’ve picked.
- Last fetch — seconds since the map last refreshed.