Monitoring
Prometheus metrics, packet logs, and live packet stream
Graywolf provides several monitoring interfaces for observing station activity and diagnosing issues.
Prometheus Metrics
Graywolf exposes a Prometheus-compatible /metrics endpoint
on the HTTP port. Point your Prometheus scrape config at it to collect
station telemetry.
scrape_configs:
  - job_name: graywolf
    static_configs:
      - targets: ['graywolf-host:8080']
Available Metrics
| Metric | Type | Description |
|---|---|---|
graywolf_rx_frames_total |
counter | Received packets (label: channel) |
graywolf_rx_bad_fcs_total |
counter | Packets received with a failed FCS (CRC) check and dropped (label: channel). Reported only for modem channels; a hardware KISS TNC validates the FCS itself, so its channels never report bad frames. |
graywolf_tx_frames_total |
counter | Transmitted packets (label: channel) |
graywolf_dcd_active |
gauge | Data carrier detect state (label: channel) |
graywolf_audio_level |
gauge | Peak audio level 0–1 (label: channel) |
graywolf_child_up |
gauge | Rust modem process alive (1) or dead (0) |
graywolf_child_restarts_total |
counter | Modem crash/restart count |
| Metric | Type | Description |
|---|---|---|
graywolf_tx_deduped_total |
counter | Duplicate TX packets suppressed |
graywolf_tx_rate_limited_total |
counter | Packets dropped by rate limiter |
| Metric | Type | Description |
|---|---|---|
graywolf_digipeater_packets_total |
counter | Packets digipeated |
graywolf_beacon_packets_total |
counter | Beacon transmissions (label: type) |
graywolf_igate_rf_to_is_gated_total |
counter | Packets gated from RF to APRS-IS |
graywolf_igate_is_to_rf_gated_total |
counter | Packets gated from APRS-IS to RF |
| Metric | Type | Description |
|---|---|---|
graywolf_kiss_clients_active |
gauge | Connected KISS clients (label: interface) |
graywolf_agw_clients_active |
gauge | Connected AGWPE clients |
graywolf_gps_parse_errors_total |
counter | GPS parse errors (label: source) |
Understanding "Bad FCS"
Every AX.25 frame ends with a two-byte Frame Check Sequence
(FCS) — a CRC‑16/CCITT checksum the sender computes over the
packet. The receiver recomputes it and compares. The dashboard's
Bad FCS counter (and the
graywolf_rx_bad_fcs_total metric) counts frame-shaped
signals that the modem demodulated all the way to a closing HDLC flag
but whose checksum did not match — so the frame was rejected and
dropped rather than passed on.
Only plausible candidates are counted: the demodulator must have found an opening and closing flag with at least a minimum-length packet of bits between them, and the frame must have failed both the direct check and every configured bit-fix retry. Pure noise, runts, and aborts are not counted. In other words, Bad FCS represents real HDLC-shaped energy on the channel that almost decoded but didn't.
It is a trend, not a precise packet count. Graywolf runs several bit-slicers per channel in parallel to maximize good decodes. A single burst of noise can look like a broken frame to many slicers at once, so the modem deliberately reports the bad-FCS tally from one representative slicer instead of summing all of them. Treat the number as a signal-quality indicator that you watch over time, not as an exact tally of lost packets.
What counts as a "high" value?
There is no fixed threshold, because a healthy value depends entirely on what your receiver hears. The two things that matter are the ratio of bad to good frames and the trend over time — not the raw number.
| Pattern | Most likely meaning |
|---|---|
| Many bad FCS and a healthy, growing good-frame count | Usually benign. A sensitive, wide-coverage receiver on a busy uncoordinated channel (such as 144.390 MHz APRS) hears constant collisions and distant stations right at the edge of decodability. A bad:good ratio of several‑to‑one is common and is not by itself a fault. |
| Many bad FCS but few good frames | Points at a local problem rather than the band: receive audio too hot (clipping) or too weak, a twist / de-emphasis mismatch, or RF interference — classic offenders include USB / switching-supply EMI near the radio or sound device. |
| A previously low count that climbs steadily | Something changed: a new noise source, an antenna or connector problem, or a drifted audio level. Investigate the change, not the absolute number. |
So a station seeing, for example, ~4,500 bad versus ~1,000 good frames is not automatically in trouble — on a busy APRS receiver that ratio is plausibly just collisions and weak DX. The question to answer is whether the good count is healthy for your location and whether the audio is clean. Use the steps below to decide.
Diagnosing poor FCS performance
- Check the good-frame rate alongside it. If RX is still climbing at a normal pace for your area, you are mostly hearing collisions and marginal traffic — benign. If good frames have stalled while Bad FCS keeps rising, treat it as a local fault.
- Look at the channel's audio level. On the dashboard, the per-channel level bar should peak comfortably without pinning at the top (clipping) or barely moving (too weak). Both extremes wreck the FCS rate.
- Record a clip and decode it offline. Capture a short
.wavof live traffic and run it back through the real demodulator:
Watchgraywolf-modem --decode rx.wavrx_bad_fcsversusrx_frames, and checklevel_dbfs_med(near 0 dBFS means clipping; very low means too weak) andtwist_db_med(a large twist points at a de-emphasis / audio-response problem rather than overall level). See Audio Devices for the full field list. - Tune against the same clip. Because
--decodeis deterministic on a fixed file, decode the same recording repeatedly while adjusting receive gain; the setting that yields the mostrx_frameswith the fewestrx_bad_fcsand no clipping wins. - Hunt for interference. If the audio is clean but Bad FCS stays high with few decodes, suspect EMI — move USB cables, sound interfaces, and switching supplies away from the radio and antenna feed.
A hardware KISS TNC validates the FCS itself and never forwards a bad frame, so its channels always show Bad FCS: 0. The metric is only meaningful for software-modem (sound-card) channels, where Graywolf does the demodulation and checksum itself.
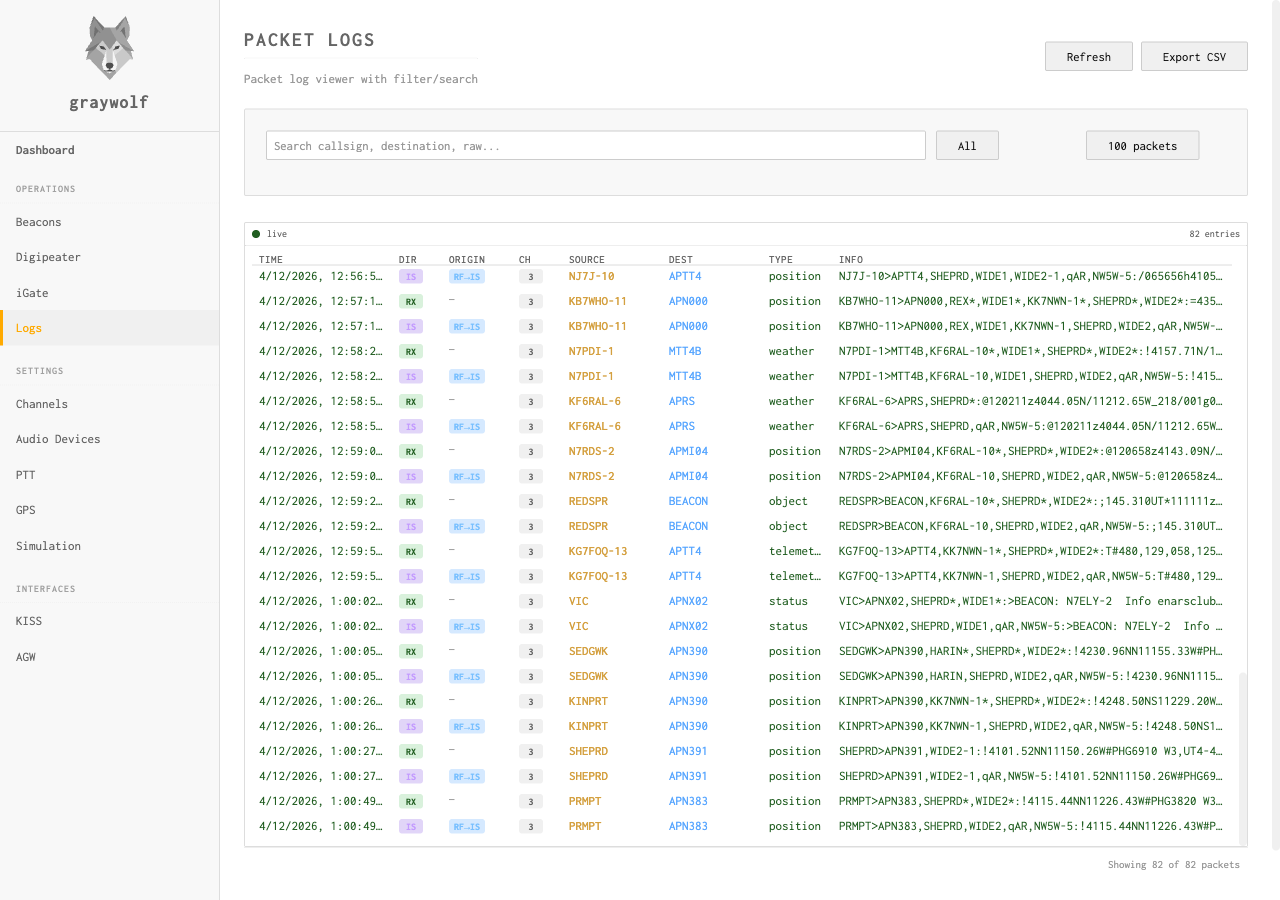
Packet Log API
The packet log maintains a ring buffer of the most recent packets (up to 1000 entries, 30-minute age limit). Query it via the REST API or view it in real time through the web UI.
| Method | Endpoint | Description |
|---|---|---|
| GET | /api/packets |
Query packet history (filterable by time, direction, channel) |
| WebSocket | /ws/packets |
Live packet stream |
Packet Entry Fields
| Field | Description |
|---|---|
timestamp | ISO 8601 timestamp |
channel | Radio channel number |
direction | RX, TX, or IS |
source | Origin: modem, kiss, agw, beacon, digi, igate-tx, igate-is |
display | Human-readable packet string |
type | APRS type: position, message, weather, etc. |
decoded | Parsed APRS data (position, message, telemetry objects) |
raw | Base64-encoded raw AX.25 frame |
Health Check
A lightweight health endpoint is available for load balancers and monitoring systems:
GET /api/health

{
  "status": "ok",
  "time": "2026-04-11T10:00:00Z",
  "started_at": "2026-04-11T08:30:00Z"
}
Status Endpoint
The status endpoint returns aggregated dashboard data in a single request — uptime, per-channel stats (RX/TX counts, DCD state, audio peak), and iGate connection status:
GET /api/statuspprof Debug Profiles
Graywolf can expose Go's net/http/pprof endpoints on a
separate listener for diagnosing memory growth, goroutine leaks, and
CPU hotspots. The listener is off by default; enable it
by passing -pprof <addr>.
The pprof listener has no authentication. The
endpoints reveal heap layout, goroutine stacks, and process command
line. Always bind to loopback
(127.0.0.1:6060). A non-loopback bind logs a warning
at startup but is still permitted for trusted-network profiling.
Disable the flag (omit it) when not actively investigating.
graywolf -pprof 127.0.0.1:6060Common captures
# Heap snapshot (live allocation)
curl -o heap.prof http://127.0.0.1:6060/debug/pprof/heap

# Goroutine stack dump (human-readable)
curl http://127.0.0.1:6060/debug/pprof/goroutine?debug=2

# 30 s CPU profile
curl -o cpu.prof http://127.0.0.1:6060/debug/pprof/profile?seconds=30

# 5 s execution trace
curl -o trace.out http://127.0.0.1:6060/debug/pprof/trace?seconds=5

# Interactive web UI for any profile
go tool pprof -http=:8081 heap.prof
Memory leak workflow
- Capture a baseline heap profile after warmup
(
curl -o base.heap ...). - Wait through a representative workload window (30+ minutes).
- Capture a second profile (
later.heap). - Diff with
go tool pprof -http=:8081 -base base.heap later.heapand look at the inuse_space view. The diff highlights what grew between snapshots, which is what a leak looks like.
Note: the Rust modem child process is a separate PID and is not visible
to Go pprof. Watch its memory through
process_resident_memory_bytes on the Prometheus side or
ps -o rss against the modem PID.
Logging
Graywolf outputs structured logs to stderr. By default, logs are at
INFO level. Enable verbose logging with the
-debug flag.
When running under systemd, logs are captured by the journal and queryable with:
journalctl -u graywolf -fDebug logging includes per-packet decode details, IPC message traces, and CSMA timing decisions. Enable it when troubleshooting decode or transmission issues.